

Microbiome-Health
Powered by Ratios
CARB-to-FIBER
Try a science-based
FOOD QUALITY SCANNER
How do your favorites score?
Nutrient Consume Score — NCS
Nutrient Consume Score (NCS) is a science-based tool to make healthy food choices easier. It converts complex nutrition science into simple 1–100 quality scores using key ratios, like carb-to-fiber, tied to microbiome & metabolic health.
Also introducing a public-good, NCS-powered food quality scanner, for finding healthy choices as you shop, eat & cook.

The Calculator
► Type Favorite Food, What is the score?
► Combine 2 Foods, +, How do they mix?
► Type a Wild Card, *, What foods return?
The Score
The NCS algorithm integrates the latest literature on nutrient ratios and bioactives to inform an overall food quality score. It references the USDA’s FoodData Central (FNDDS 2021-2023) for nutrient values of individual foods. NCS scores of 70-100 and subscores of less than 2 correlate with healthier uprocessed & packaged foods.

Maximize green, moderate yellow, and minimize red scoring foods in amount and frequency. Ratio Subscores can be used as guides for combining foods to optimize nutritional balance in meals & recipes.

►Green (100-70): Maximize
►Yellow (69-60): Moderate
►Red (59-0): Minimize

The Evidence
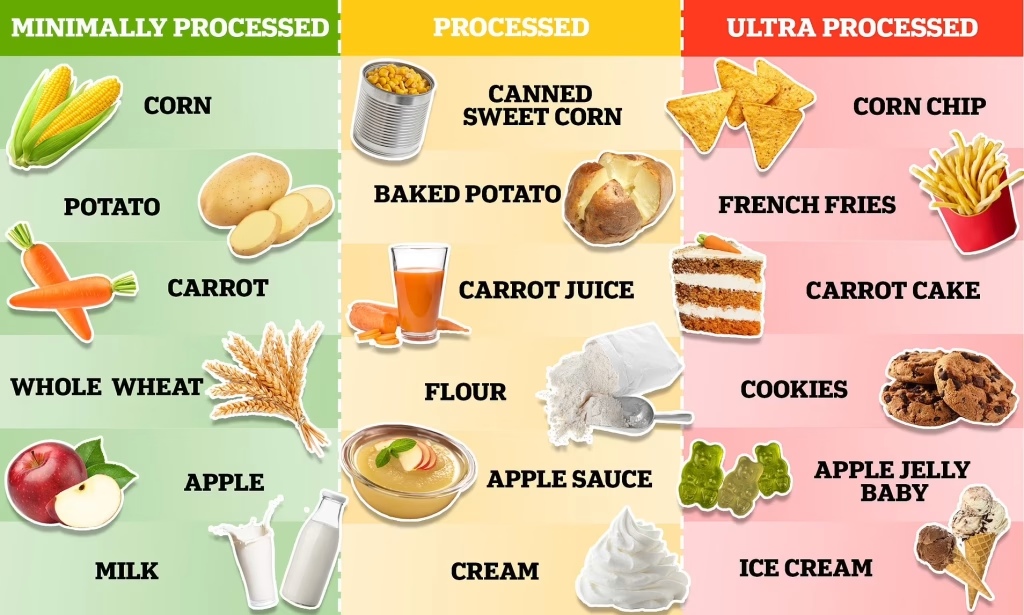
Food processing in its current form has disrupted the natural ratios present in whole food matrixes, concentrating for simple carbohydrates, saturated fats, sodium, and additives while limiting fiber, unsaturated fats, potassium, and bioactives. Some of the latest research is suggesting that disrupted ratios that involve both concentrated and insufficient nutrients are important contributors to the rising rates of gut, metabolic, cardiovascular & neurologic disease.[1,2]
Nutrient ratios that provide a composite score of carb, fat, and micronutrient quality have been associated with a lower odds ratio for metabolic syndrome, diabetes, cardiovascular disease, cancer, and lung disease as well as higher odds ratio for optimal cardiometabolic health.[3,4]

Carb-to-Fiber Ratio (i.e. Carb Quality) is associated with better health[5]: lower depression[6], smaller waist[7], lower diabetes rates[8–10], and less heart disease[11,12]. Fiber slows the absorption of carbs and is converted by the microbiome to factors like butyrate that help to efficiently process them once absorbed. For more information on fiber please follow this link.
Total Fat-to-Unsaturated Fat Ratio (i.e. Fat Quality) is also associated with health: improved blood lipids and glycemic control.[13] For more information on fats please follow this link.
Sodium-to-Potassium Ratio (i.e. Salt Quality) has been associated with lower blood pressure[14] and interventions have lead to decreased blood pressure and stroke.[15] For more information on sodium and potassium please follow this link.
Additives & Bioactives Some unnatural additives like certain sugar alternatives[16], trans fats[17], and some emulsifiers[18] have been linked to poor health markers or outcomes while other natural bioactives like polyphenols[19] and short chain fatty acids (e.g. acetic acid[20], butyrate[21]) have been linked to better health outcomes. For more information on polyphenols follow this link.
The Manuscript
NCS ranks among top Food Scoring Systems in its link to lower rates of Obesity and better Metabolic Health.

Key: Nutrient Consume Score (NCS), Food Compass 2.0 (FC2), Health Star (HS), Nutri-Score (NS), and NOVA Classification (NC).
The Food Quality Scanner

Smart Nutrition
in Your Pocket
NCS-powered, mission-driven quality scanner to simplify healthy food choice.
- SCAN for 1-100 scoring
- SWAP to smarter options
- SCORE meals & recipes
- TRACK your health gains
A heartfelt thanks to Ben Roberts and Luke Walker for their volunteered artful coding. And grateful to Jennie Damman & family for their ever-wise input & advice.
Fuel Your Best

Try a science-based
FOOD QUALITY SCANNER
How do your favorites score?

This resource provides general dietary guidance and is for informational purposes only. It is not a substitute for professional medical advice. Always consult your physician or a qualified healthcare provider with any questions regarding your health or medical conditions.
References
1. Fardet A, Rock E. Chronic diseases are first associated with the degradation and artificialization of food matrices rather than with food composition: calorie quality matters more than calorie quantity. Eur J Nutr. 2022;61: 2239–2253. doi:10.1007/s00394-021-02786-8
2. Mozaffarian D. Dietary and policy priorities to reduce the global crises of obesity and diabetes. Nature Food. 2020;1: 38–50. doi:10.1038/s43016-019-0013-1
3. Mozaffarian D, El-Abbadi NH, O’Hearn M, Erndt-Marino J, Masters WA, Jacques P, et al. Food Compass is a nutrient profiling system using expanded characteristics for assessing healthfulness of foods. Nature Food. 2021;2: 809–818. doi:10.1038/s43016-021-00381-y
4. O’Hearn M, Erndt-Marino J, Gerber S, Lauren BN, Economos C, Wong JB, et al. Validation of Food Compass with a healthy diet, cardiometabolic health, and mortality among U.S. adults, 1999–2018. Nat Commun. 2022;13: 1–14. doi:10.1038/s41467-022-34195-8
5. Mozaffarian RS, Lee RM, Kennedy MA, Ludwig DS, Mozaffarian D, Gortmaker SL. Identifying whole grain foods: a comparison of different approaches for selecting more healthful whole grain products. Public Health Nutr. 2013;16. doi:10.1017/S1368980012005447
6. Makhani SS, Davies C, George KA, Castro G, de la Vega PR, Barengo NC. Carbohydrate-to-Fiber Ratio, a Marker of Dietary Intake, as an Indicator of Depressive Symptoms. Cureus. 2021;13. doi:10.7759/cureus.17996
7. Sawicki CM, Lichtenstein AH, Rogers GT, Jacques PF, Ma J, Saltzman E, et al. Comparison of Indices of Carbohydrate Quality and Food Sources of Dietary Fiber on Longitudinal Changes in Waist Circumference in the Framingham Offspring Cohort. Nutrients. 2021;13: 997. doi:10.3390/nu13030997
8. AlEssa HB, Bhupathiraju SN, Malik VS, Wedick NM, Campos H, Rosner B, et al. Carbohydrate quality and quantity and risk of type 2 diabetes in US women. Am J Clin Nutr. 2015;102: 1543–1553. doi:10.3945/ajcn.115.116558
9. Hashimoto Y, Tanaka M, Miki A, Kobayashi Y, Wada S, Kuwahata M, et al. Intake of Carbohydrate to Fiber Ratio Is a Useful Marker for Metabolic Syndrome in Patients with Type 2 Diabetes: A Cross-Sectional Study. ANM. 2018;72: 329–335. doi:10.1159/000486550
10. AlEssa HB, Ley SH, Rosner B, Malik VS, Willett WC, Campos H, et al. High Fiber and Low Starch Intakes Are Associated with Circulating Intermediate Biomarkers of Type 2 Diabetes among Women. J Nutr. 2016;146: 306–317. doi:10.3945/jn.115.219915
11. Fontanelli M, Sales C, Liu J, Micha R, Mozaffarian D, Fisberg RM. The ≤ 10:1 carbohydrate to fiber ratio to identify healthy grain foods and its association with cardiometabolic risk factors in Brazil. Proc Nutr Soc. 2020;79: E309. doi:10.1017/S0029665120002578
12. AlEssa HB, Cohen R, Malik VS, Adebamowo SN, Rimm EB, Manson JE, et al. Carbohydrate quality and quantity and risk of coronary heart disease among US women and men. Am J Clin Nutr. 2018;107: 257–267. doi:10.1093/ajcn/nqx060
13. Schwingshackl L, Zähringer J, Beyerbach J, Werner SS, Heseker H, Koletzko B, et al. Total Dietary Fat Intake, Fat Quality, and Health Outcomes: A Scoping Review of Systematic Reviews of Prospective Studies. Ann Nutr Metab. 2021;77. doi:10.1159/000515058
14. Binia A, Jaeger J, Hu Y, Singh A, Zimmermann D. Daily potassium intake and sodium-to-potassium ratio in the reduction of blood pressure: a meta-analysis of randomized controlled trials. J Hypertens. 2015;33. doi:10.1097/HJH.0000000000000611
15. Neal B, Wu Y, Feng X, Zhang R, Zhang Y, Shi J, et al. Effect of Salt Substitution on Cardiovascular Events and Death. N Engl J Med. 2021;385. doi:10.1056/NEJMoa2105675
16. Suez J, Cohen Y, Valdés-Mas R, Mor U, Dori-Bachash M, Federici S, et al. Personalized microbiome-driven effects of non-nutritive sweeteners on human glucose tolerance. Cell. 2022;185. doi:10.1016/j.cell.2022.07.016
17. Mozaffarian D, Aro A, Willett WC. Health effects of trans-fatty acids: experimental and observational evidence. Eur J Clin Nutr. 2009;63: S5–S21. doi:10.1038/sj.ejcn.1602973
18. Naimi S, Viennois E, Gewirtz AT, Chassaing B. Direct impact of commonly used dietary emulsifiers on human gut microbiota. Microbiome. 2021;9: 1–19. doi:10.1186/s40168-020-00996-6
19. Del Bo’ C, Bernardi S, Marino M, Porrini M, Tucci M, Guglielmetti S, et al. Systematic Review on Polyphenol Intake and Health Outcomes: Is there Sufficient Evidence to Define a Health-Promoting Polyphenol-Rich Dietary Pattern? Nutrients. 2019;11: 1355. doi:10.3390/nu11061355
20. Valdes DS, So D, Gill PA, Kellow NJ. Effect of Dietary Acetic Acid Supplementation on Plasma Glucose, Lipid Profiles, and Body Mass Index in Human Adults: A Systematic Review and Meta-analysis. J Acad Nutr Diet. 2021;121. doi:10.1016/j.jand.2020.12.002
21. Amiri P, Hosseini SA, Ghaffari S, Tutunchi H, Ghaffari S, Mosharkesh E, et al. Role of Butyrate, a Gut Microbiota Derived Metabolite, in Cardiovascular Diseases: A comprehensive narrative review. Front Pharmacol. 2022;12. doi:10.3389/fphar.2021.837509
66 responses
how will i know when the app is available for iPhones?
Thanks for your good question. I will be sure to send a note out to folks as soon as it’s available. Best, Dr. D
This was eye opening. I thought I was getting fiber, but no. I haveve IBS- D. I follow the formal diet, foods listed high I can’t eat at all and done things on the low side I also don’t tolerate. ( gas, diarrhea). I don’t tolerate fiber, and am eating a high carb diet. Would like to change but don’t know how. Any suggestions would be welcome
Hi April, I’m glad to hear you found it helpful and sorry to hear fiber is tough on your gut. You articulate the experience of many people and I’m grateful for your comment. I might suggest you work with your healthcare provider or registered dietician on finding which of the FODMAPs trigger your symptoms. It’s equally eye opening to some that not all fiber is treated by individual microbiomes in the same way. Here is a GutBites digest that provides a little more background. My best wishes, Dr. D https://gutbites.org/2022/05/01/are-all-fibers-to-be-plated-equal/
Would love to try this, but it doesn’t seem to work. Can type in something, but the search bar doesn’t work. Am I doing something wrong?
Hi D, Sorry it’s not working. I wonder if you’ve tried the site on a different web browser or different computer/phone/device? Please let me know if this doesn’t help. Best, Dr. D.
My husband has been doing Noom with much success. This Red, Yellow, Green and how it calculates food look a lot like this. What is the difference?
Congratulations on your husband’s success! Sharing a few thoughts on your good question below.
Methodological and philosophical differences:
-Granular 1-100 score with color gradients vs. red, orange, yellow score
-Algorithm driven by nutrient ratios (see above for rationale) vs. calorie and nutrient density
-Emphasis on overall health with weight, blood sugar, and gut benefits vs. greater emphasis on weight loss
-Pro bono public service vs. paid for profitHope that helps! Happy to answer any follow up questions.
Compare how the scores differ for food categories in the two links below:
-Gut Bites NCS: https://gutbites.org/wp-content/uploads/2023/05/Slides-For-Website.pdf
-NOOM: https://www.goodhousekeeping.com/health/diet-nutrition/a30930989/noom-food-list/
How do I get the app?
The app is still in development. I will send out a notification as soon as it is available. In the meantime please feel free to use the online calculator to get a sense of how the algorithm works. Thanks for your inquiry.
You mentioned the glycemic index. How does this factor into your algorithm?
The glycemic index isn’t in the algorithm explicitly but carb to fiber ratio follows glycemic index quite closely. The algorithm also takes into account the benefit of combining simple carbs with protein and high quality fats. Thanks for the question.
What about high fiber versions of common foods such as tortillas, breads and crackers? Will they be listed by brand and not lumped into a category?
This is a great question. The majority of US products and their bar codes will be covered.
thank you this looks great.
Tina, Thanks so much for the positive feedback! Dr D
Thanks Chris,
Is lower COMPOSITE SCORE better than higher?
Green is generally higher quality for both composite and subscores.
Thanks for the tool and carb:fiber ratio info.
Question –
1. What is the number right after CARBS?
eg. Avocado, raw – CARBS 1.13, Total Carb 8.53, Fiber 6.7gThe highlighted numbers next to each of the nutrients represent a nutrients quality scale that’s based on ratios. Generally, the lower the number, the higher quality, but I would focus instead on the colors which mirror those in the composite 1-100 score.
Leave a Reply